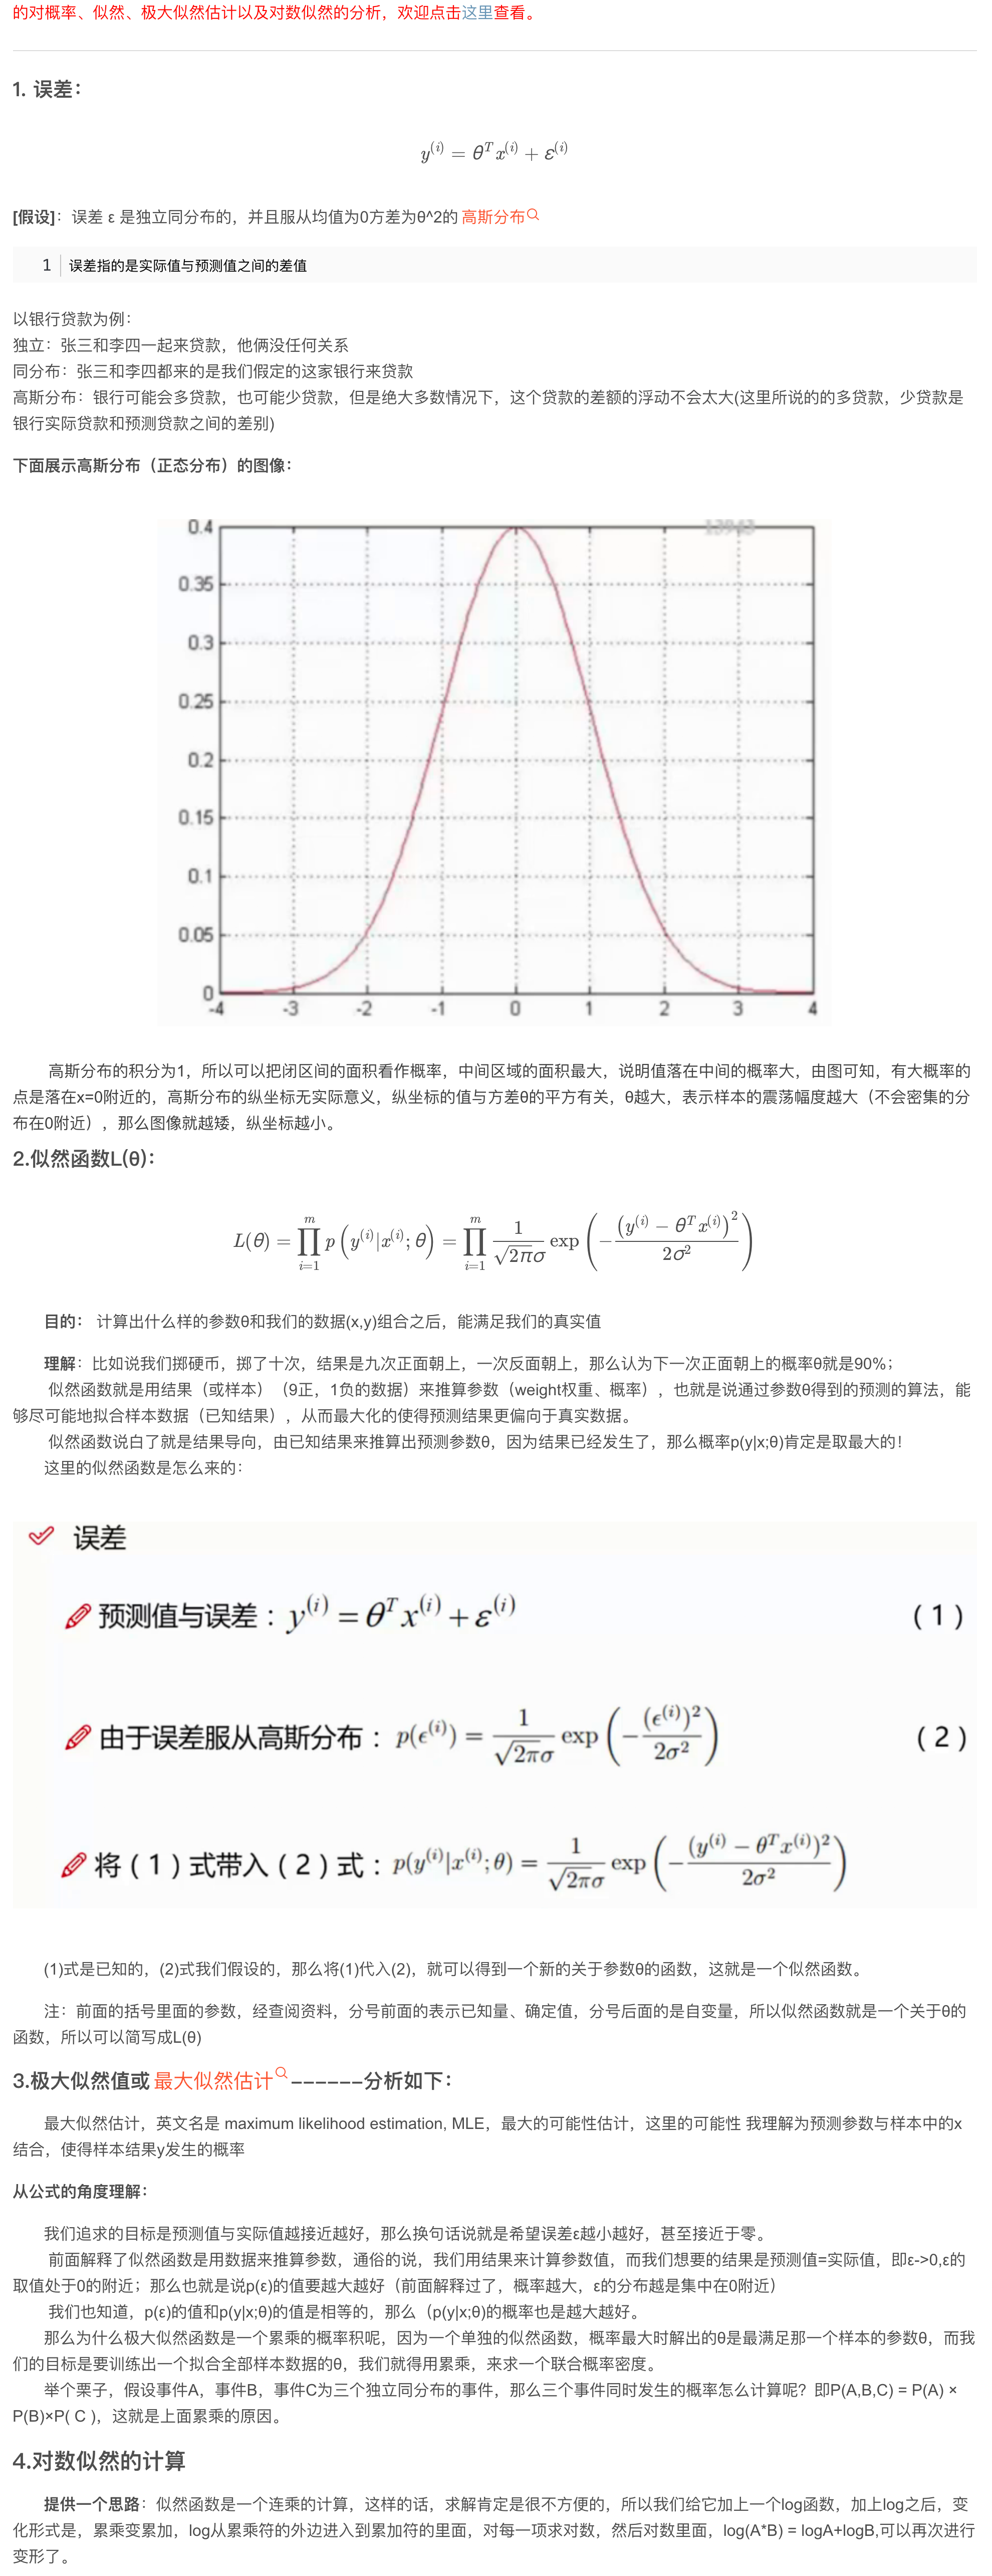
注意:高斯分布图x轴坐标是变量X的取值,纵坐标是概率
因此,这里得到误差l(打不了误差符号),最大误差的密度概率是因为=》最大概率处l=0, 同时我们追求的也是误差最小,无限接近0,所以这里要对误差l的PDF取最大值,因此,每个样本的最大概率(最大似然)累乘就是我们需要优化的结果。
Previous
 smartpointer
2022-03-04
Next
 VCDimension
2022-02-10