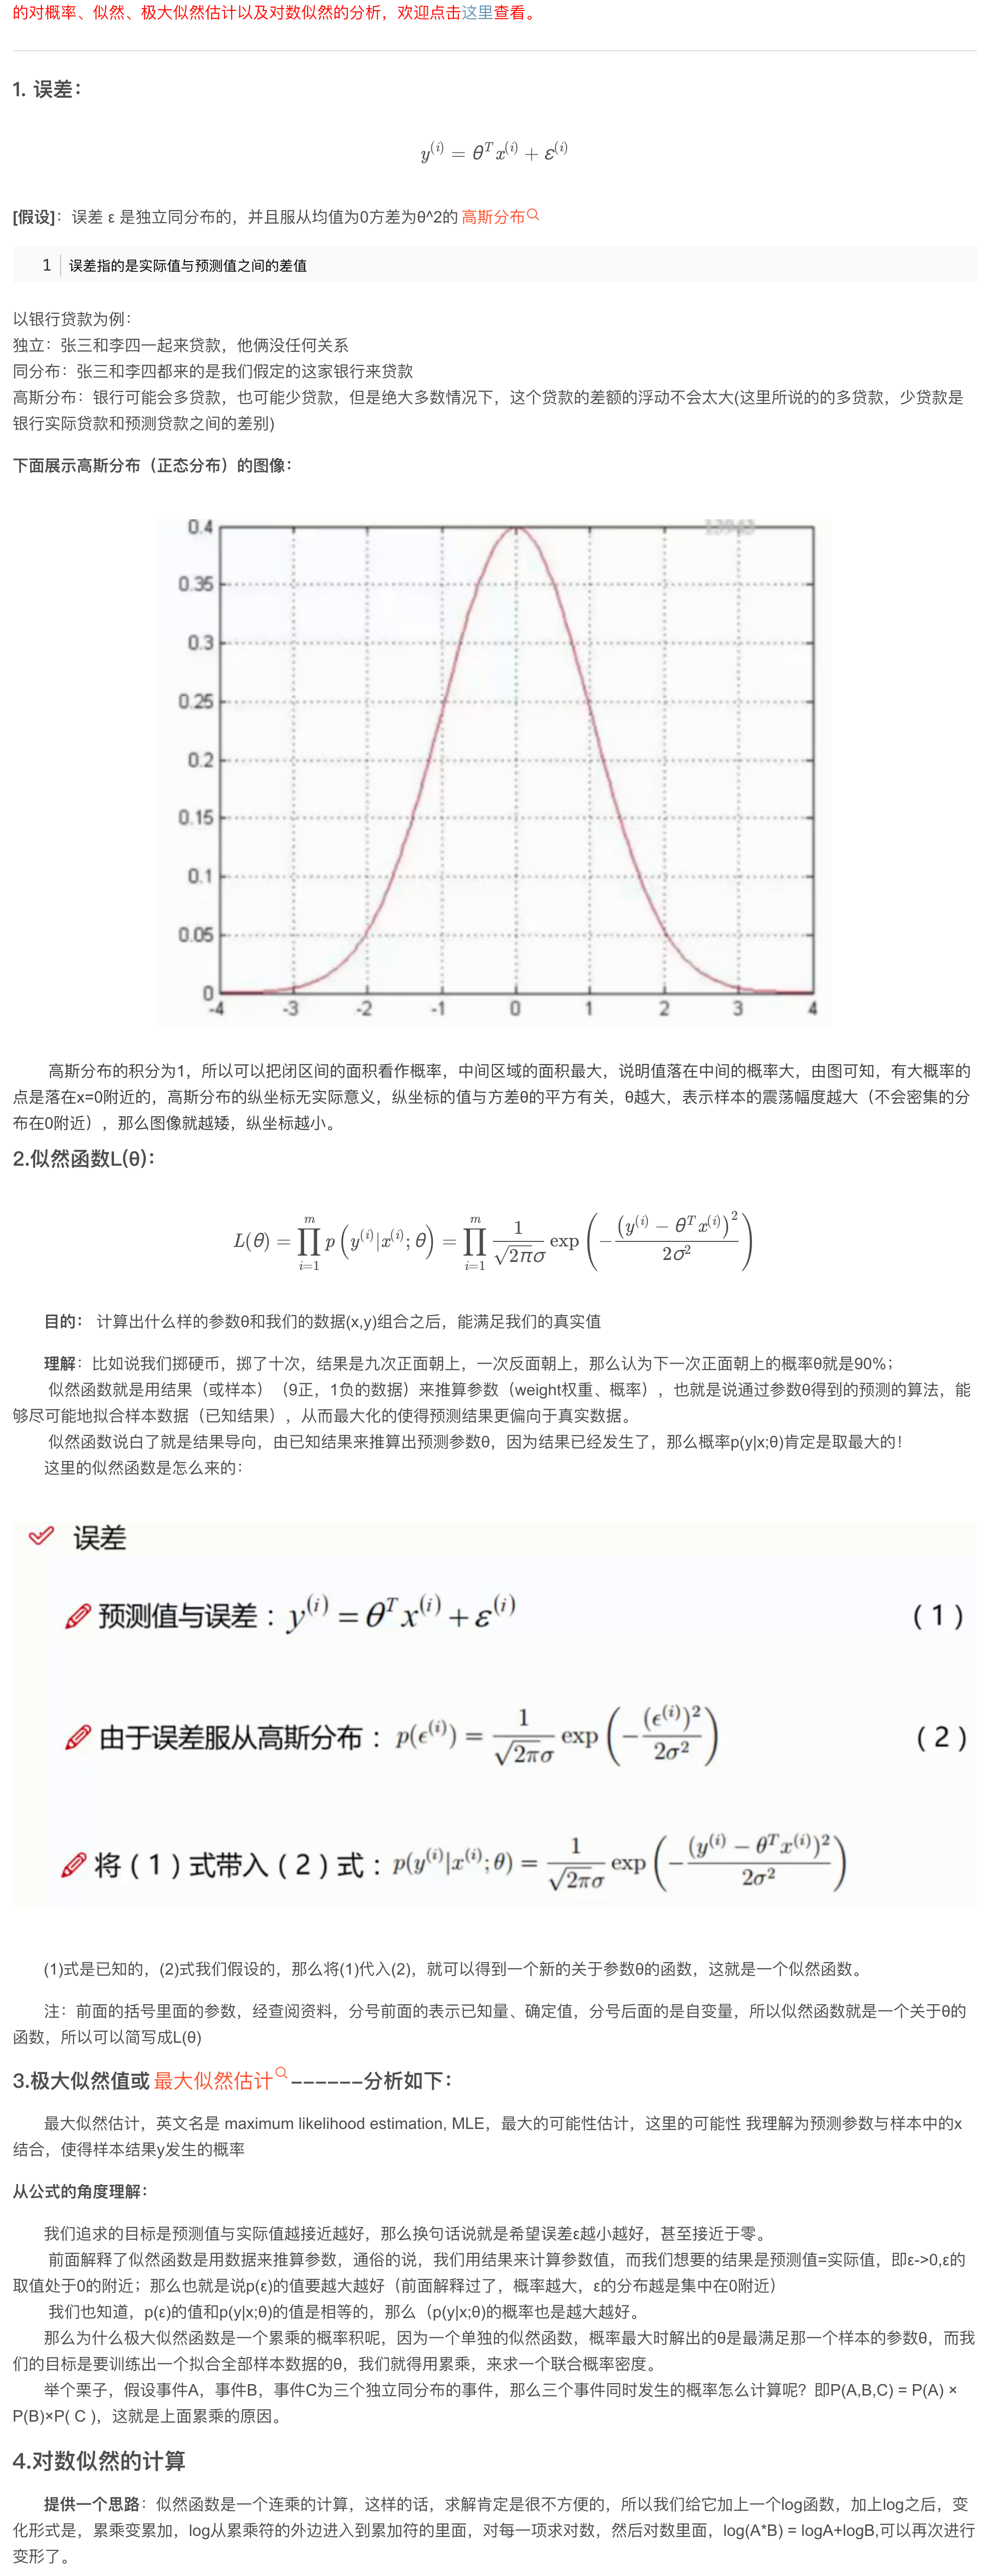
Note: in a Gaussian distribution plot, the x-axis is the value of the variable X and the y-axis is the probability.
So here we get the error l (I can't type the error symbol). The probability density is highest at the point of maximum probability, l = 0, and what we want is also the smallest error, as close to 0 as possible. So we take the maximum of the PDF of the error l; therefore, the product of the maximum probabilities (maximum likelihood) over all samples is the objective we need to optimise.